- 2025
- 2024
- 2023
- 2022
- 2021
- The Forest System
- 2020
- A place to read
- Counterfactual
- Deep Sleep
- Fixing Sounds
- Ghost Populations
- Grey Matter
- Humanities
- Impôts.gouv
- My Precious One
- OK computer
- One for all
- Perfect Match
- Personal Borders
- Trial by fire
- Unconscious
- 2019
- Anonymous
- Daily science
- Houston 69
- Image and text
- La santé autrement
- Parts and labour
- Playing with fire
- Plu-present
- The art factory
- The legend factory
- The nuclear effect
- Unique every time
- Vertical
- What exactly is happiness?
- striking a chord
- 2018
- Animal images
- Connections
- Current affairs
- Extra space
- Les courts circuits
- Metamorphoses
- Off ground
- Playing with fire
- The Earth quakes
- The life of rays
- The ocean phenomenon
- The scope of cinema
- The struggle continues
- Top model
- Traces
- What is peace?
- 2017
- All about the climate
- Artistic territory
- Cars
- In all probability
- Inner journey
- Letter to a friend
- Planetarium
- Plants and us
- Polyptics
- Poster child
- Propagation of monotony
- Rocks unlimited
- Tour operator
- We, the presidents
- Youth culture
- 2016
- 3D universe
- Art curator
- Bioethics
- Colours
- Community radio
- Different books - digital design
- Different books - paper design
- Hands on
- Images - Mémoires
- In all probability
- Landscapes
- Meteors
- Microscopic
- Mirages
- Pantone Food
- The great outdoors
- The idiots' guide to teenagers
- The night
- There were several of them
- Under the surface
- 2015
- Books otherwise
- By prescription
- Denim
- Feet on the ground
- Intermediate schools in France
- Meteorologists
- Occupation: inventor
- Outdoors
- Sweet treats
- The art of love
- The climate in fiction
- To be completed
- Universal light
- Urban life
- What is today?
- Words and music
- 2014
- Are you modern?
- Aroma research
- Calculating sound
- Digital dreams
- Female landscape
- Hung up
- Infinite at top speed
- Les Grandes Tables
- Life in the laboratory
- Listening to the sacred
- Short trips into the working world
- The age of the earth
- Use and reuse
- Water
- Words and music
- Words and things
- 2013
- Aroma research
- As if by chance
- Behind the screen
- By what right?
- In praise of mixity
- Infinity at top speed
- Listening to the sacred
- Looking at animals
- Mass markets
- Memory
- On promotion
- Once upon a time: Art
- Segami
- Sensitive boundary
- Short trips into the working world
- The French factory
- Truth in sport
- 2012
- A simple movement
- Animalia
- Archigram
- Babel
- By what right ?
- Dinner's served!
- Experience of the world
- Found objects
- Money
- Once upon a time: Art
- Perceptible split
- Phenomena
- Serious games
- Television
- Warmly dressed
- 2011
- Animalia
- Balance of power
- Breathless
- Chemistry year
- Cities and architectures
- Eurêka
- Experience of the world
- Food
- Found objects
- Homepage
- Once upon a time
- Public life
- Television
- Under constraint
- Video games
- Vostok
- What to wear
- 2010
- Chimie en cuisine
- Eurêka
- Evolution
- Jeux vidéo
- La bioéthique
- La richesse - philosophie
- La richesse - sociologie
- Les adolescents - photographie
- Les adolescents - sociologie
- Objets trouvés
- Quel grand Paris?
- Rapprochement des cultures
- Sous contraintes
- Télévision
- Village global
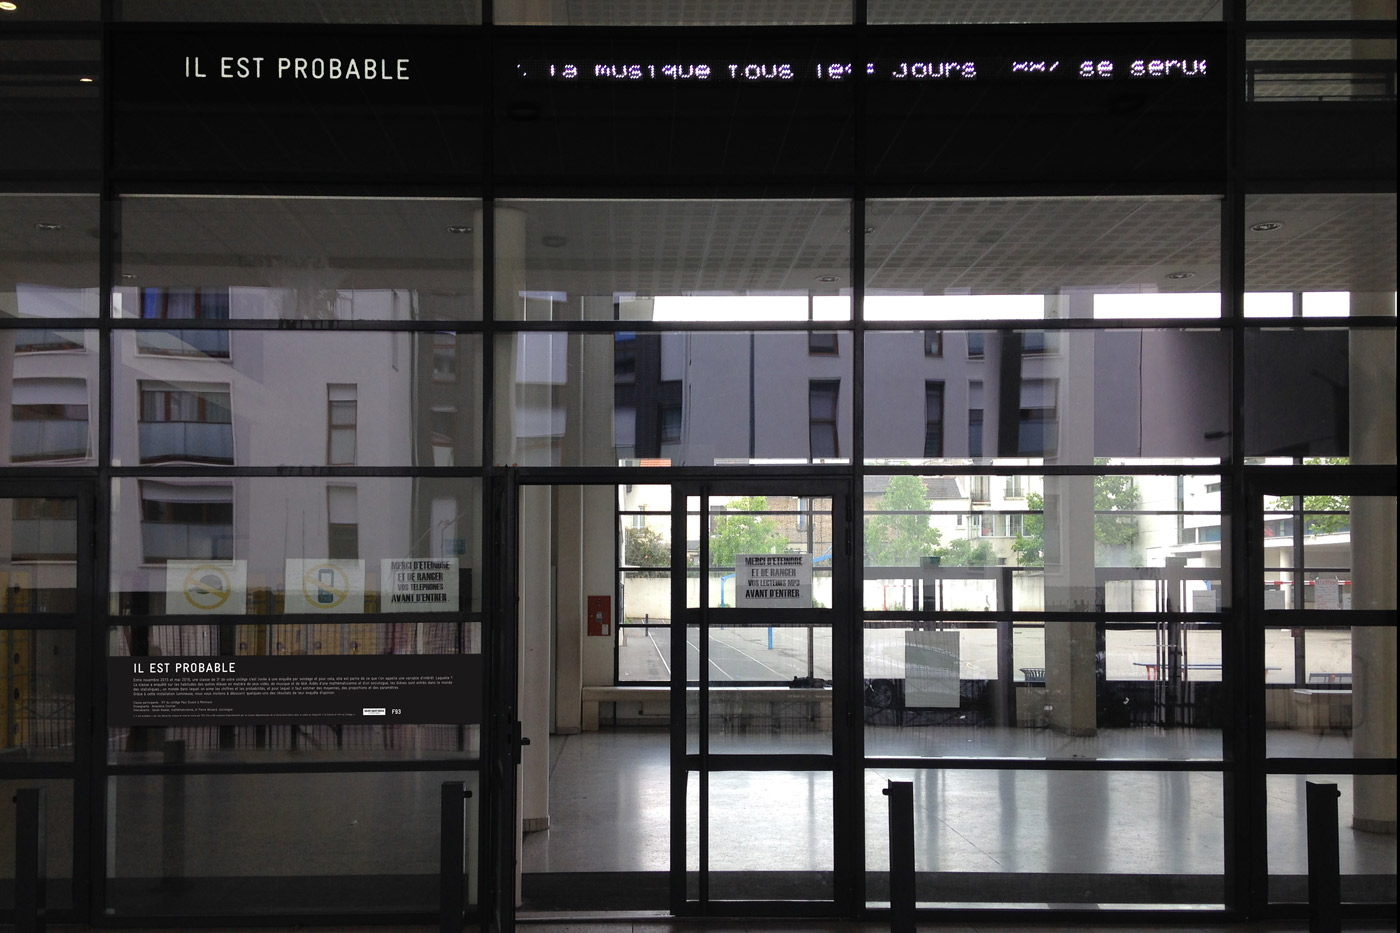
In all probability
Since 2009, the Seine-Saint-Denis County Council has been backing “la Culture et l’Art au Collège (CAC)”. This project is based to a large extent on the presence in class for several weeks (40h) of an artist or scientist whose mission is to engage the students in a process of research and creation.
​Tutors: Sarah Kaakai/ PhD student in mathematics, Pierre Boisard/ sociologist
Project manager: Anna Mezey
Objectives:
In mathematics, can a random event be calculated? Probabilities and statistics would seem to imply that the answer is yes. In that case, how do we go about analysing what would seem to be pure chance? With the help of a mathematician and assisted by a sociologist, the students conduct a survey and try to interpret their everyday lives using statistics tools.
Workshop:
Our days are numbered
The contributor explains examples of statistics using, among other things, examples of opinion polls from the press. The students then carry out several exercises with her assistance: what is the probability of its being a boy or a girl if someone is chosen at random from the class? What is the probability that this person has a smartphone? Etc.
Surveys at school
The students choose a survey theme connected to leisure activities and applied to all the students in the final year of middle school. With the sociologist, they draw up a questionnaire taking into account what are known as “variables to measure” (qualitative and quantitative), open-ended or closed-ended questions, so-called “socio-demographic” questions, etc. A questionnaire of around 20 questions is used to carry out a survey among the other final-year classes. The responses obtained are encoded by the students using a grid.
Descriptive statistics
The questionnaires have supplied statistics and it is now time to verify whether or not they provide answers to the questions, and to which questions, with regard to students’ leisure activities. At this point, the class also learns about margins of error and the notion of uncertainty. With the contributor, the students suggest counter-intuitive cross-checks: is there a relationship between students who listen to music every day and those who never read? Between those who play video games and those who play football? Between boys and girls?
Outcome:
From 13th – 21st June 2016, the middle school published a selection of the survey results using an installation of neon signs in the hall: 31% play video games every day – of these 33 people, there are 4 girls i.e. 12%. Amongst the girls, only 36% play video games; amongst the boys, the figure is 95%. 66% listen to music on the Internet, etc.
Outing:
- PALAIS DE LA DÉCOUVERTE, THE EXHIBITION "DU HASARD AUX MATHÉMATIQUES" (CHANCE IN MATHS).
Participating school:
- Class 3eF, Collège Paul Eluard, Montreuil
Photo and scenography: E.DESCOUBES